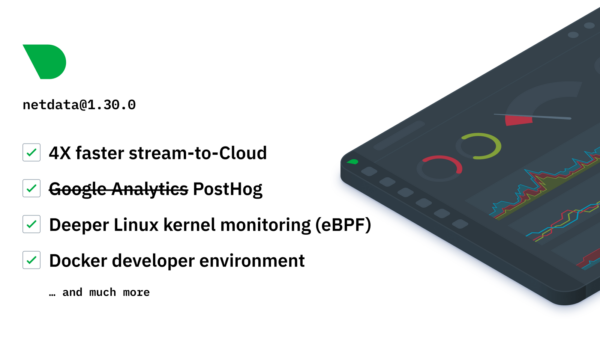
We’re excited to introduce Netdata 1.30.0, which features:
- ACLK-NG: A new custom library for streaming metrics data on demand, written entirely in-house, that’s 4x faster than libmosquitto/libwebsockets.
- Opt-in product telemetry with PostHog: Goodbye, Google Analytics. Hello, self-hosted instance of PostHog.
- Deeper Linux kernel monitoring with eBPF: Expanding our reach into the Linux kernel with page cache and synchronization syscall monitoring.
- Smarter preconfigured alarms: Better (and less noisy) defaults, better information.
- Developer environment: Contribute to Netdata via a Docker image and VSCode integration.
- Documentation improvements & tutorials: Better standards for editing files and restarting Netdata, plus brand-new tutorials.
ACLK-NG
The ACLK-NG is a new, faster method of securely connecting a node running Netdata to Netdata Cloud. In our internal testing, it’s 4x faster than our previous implementation, which uses libmosquitto and libwebsockets.| ACLK-NG | ACLK Legacy | |||
|---|---|---|---|---|
| time (s) | MB/s | time (s) | MB/s | |
| Run 1 | 1.30 | 76.92 | 5.30 | 18.87 |
| Run 2 | 1.31 | 76.34 | 5.29 | 18.90 |
| Run 3 | 1.38 | 72.46 | 5.27 | 18.98 |
| Run 4 | 1.27 | 78.74 | 5.40 | 18.52 |
| Run 5 | 1.24 | 80.65 | 5.46 | 18.32 |
| 1.30 | 77.02 | 5.34 | 18.72 | |
To enable ACLK-NG right now, update your nodes with the --aclk-ng option:
bash <(curl -Ss https://my-netdata.io/kickstart.sh) --aclk-ngAnother added benefit of ACLK-KG is that it cuts Netdata’s dependency on libmosquitto and libwebsockets. Soon enough, we’ll stop packaging those libraries with Netdata, and you won’t have to build them during installation. One less roadblock in the way to get Netdata Cloud support in the binary package built by your favorite distribution!
Opt-in to make Netdata better with PostHog
Product telemetry, especially in an open-source project, is a controversial matter. There’s always been a way to opt-out of ending anonymous statistics, but many of you let us know that you were happy to contribute telemetry, but not through Google Analytics.The anonymous-statistics.sh script now sends events to a self-hosted instance of PostHog, which is an open-source project of its own. We own this instance, and PostHog helps us maintain it. We’ll continue to use this product telemetry, now in a much better and privacy-first format, to generate insights about usage and discover bugs.
When sending statistics to PostHog, Netdata hardcodes any fields that might contain identifiable information, such as an IP address or URL.
Of course, if you previously opted-out of anonymous statistics, this migration doesn’t change your choice. If you want to opt back in now that we’re not going the whole GA thing, just run the one-line kickstart without the –disable-telemetry option, or revert the opt-out method you used.
Deeper Linux kernel monitoring with eBPF
Netdata’s zero-configuration Linux kernel monitoring just got better, with support for page cache (cachestat) and various synchronization syscalls: sync(2), fsync(2), fdatasync(2), syncfs(2), msync(2), and sync_file_range(2).The synchronization syscalls are excellent indicators of performance issues with your applications or underlying services. For example, if your node is running a custom application and Netdata’s eBPF collector finds that you’re making a suspicious number of sync(2) calls, which flush filesystem buffers to storage devices, to a specific file descriptor, you might have just discovered a performance bug in your code.
We even have a preconfigured alarm for that one! Speaking of preconfigured alarms…
Smarter preconfigured alarms
We’ve optimized almost every alarm that comes packaged and preconfigured with Netdata when you install it. The information supplied is now a little richer and easier to follow, and alarms in general are not as unnecessarily sensitive or noisy as they used to be. More assurance that you’ll only get a critical alarm when something is truly critical.For example, here’s the before and after for an alarm for monitoring the /proc/mdstat file, which shows a snapshot of the kernel’s RAID health.
Before:template: mdstat_disks ... crit: $this > 0 info: Array is degraded! to: sysadmin
template: mdstat_disks ... crit: $this > 0 info: number of devices in the down state. \ Any number > 0 indicates that the array is degraded. to: sysadmin
Developer environment
A new developer environment (devenv) simplifies how you can work on and improve Netdata. The devenv packages everything you need to develop improvements on the Netdata Agent itself, or its collectors, in a single Docker image.Documentation improvements & tutorials
We added a variety of new content for you to peruse, such as:- Kubernetes monitoring with Netdata: Overview and visualizations
- Unsupervised anomaly detection for Raspberry Pi monitoring
- How to use any StatsD data source with Netdata
- LAMP stack monitoring (Linux, Apache, MySQL, PHP) with Netdata
- Develop a custom data collector for Netdata in Python
Community
The Netdata community continues to grow since our last major release (v1.29.0)- 16 independent contributors added 22 contributions to this release
- 1,031 members actively participated in GitHub with issues, comments, or PRs
- On GitHub, we’ve reached 52,028 stars
- @aazedo for adding collection of attribute 233 (Media Wearout Indicator (SSD)) to the smartd_log collector
- @ossimantylahti for fixing a typo in the email notifications readme
- @KickerTom for renaming abs to ABS to avoid clash with standard definitions
- @Steve8291 for improving email, cron and ups groups in the apps_group.conf
- @liepumartins for adding wireguard to the vpn group in the apps_group.conf
- @eltociear for fixing typos in main.h, backend_prometheus.c and dashboard_info.js
- @Habetdin for fixing broken external links in the WEB GUI
- @salazarp for updating the syntax for Caddy v2
- @RaitoBezarius for adding support to change IRC_PORT
Check out the release notes on GitHub for a changelog of every bug fix and improvement.
Get started
If you don’t yet have Netdata, which is always free and open source, you can get started with a single command on most Linux systems:bash <(curl -Ss https://my-netdata.io/kickstart.sh)